
Compendium One
Smorgasbord: projects and experiments across disciplines
June 2026
Ruminating
Over the past decade, I've undertaken projects in architecture, urban research, sustainable and holistic design, landscapes, and artificial intelligence, and ecology.
Although these ideas and their execution continues to evolve, I think there is a common element of emergence in the design process which I've worked to instill into most of these projects. Through parametric, generative, procedural, and often untested processes, these projects are become a breadth of study material for me to imagine exciting futures

Farming water: using megastructures to remediate eutrophic agricultural run-off in Central Valley, California. SL 2025. (Created using Rhino and Grasshopper, Houdini, and Unreal Engine)
This compendium is a collection of what I deem to be important moments in various projects I've undertaken, both professionally, and academically. These include built form, research, proposals and experiments or ideas which may not yet be off the drawing board.
Altadena Scans (2025)
Working with LiDAR & Photogrammetry in post-fire landscapes

An ortho-projection of a scanned home in Altadena, presented as one of six portraits during the "Architecture After The Fires" exhibition at SCI-Arc in 2025. (Created using AutoDesk Recap, AutoCAD, Photoshop, Rhino and Indesign)
In the aftermath of the Eaton Fire (2025), a small, student-led initiative was formed at SCI-Arc with the support of LACMA to scan six homes which were affected by the fires. The homes were primarily those of artists who saw the LiDAR scans as a means of memorializing what was lost and an anchor for their new homes.
As a part of the student group, I participated in the scanning process on site to create a photogrammetric model of the existing structures, as well as in the extended post-processing phase of the projects, where I worked with pointclouds as a visual medium to create "LiDAR portraits" of each home.
I also created and demonstrated workflows taking homeowners through the process of open-source photogrammetry and how to combine drone footage and DSLR imagery into high-fidelity 3D models of selected areas of their homes.

Still image from a LiDAR capture of the surviving structure after the fire. The scans were both a visual and inferential tool, showing which elements of traditionally built homes remained resistant to wildfires.


Images from the gallery set-up at SCI-Arc during the October 2025 exhibition "Architecture After the Fires: LA in Progress"
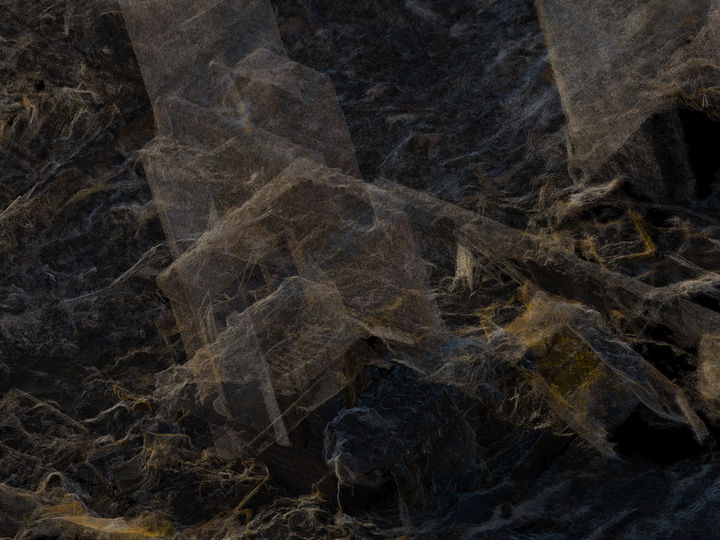
Photogrammetry-based 3D pointcloud, from drone capture of subjects. (Created using Premiere Pro, Lightroom, Metashape and Autodesk ReCap)
Working with pointclouds as a visual medium gives us the opportunity to present the ephemerality of scenes we scanned. While part of the post-process involved creating meshes from the pointclouds, we chose to represent our scans through the medium they were captured in, which was challenging.
Most important of all was creating a balance of light and dark, which, to us, the raw LiDAR captured beautifully.

This project was a student-driven initiative.
Created in collaboration with Altadena residents: Kelly Akashi, The Syms Family, Alison Amegatcher, Diana Thater, Erik Ghenoiu, and Sameer Elayyan — and a team of producers - Joel Feree, Sara Simon, Ade Ayoade, Natalie Rubio, Kahin Vasi, Marti Vera, Carlos Bonachea, Kai Johnson, Jillian Leedy, Sophie Pennetier, Pierce Meyers, and Matt Shaw - with the support of the SCI-Arc Resilient Futures Task Force, LACMA Art & Technology Lab, ScanLAB Projects, PT Capture, and The Little Things AI.
The Synthetic Landscapes Postgraduate Program at SCI-Arc was an exploration into how we can work with, represent, and understand "landscapes" in an increasingly urban, technological, and industrial setting.
My work during the course of this program considered ideas such as bioremediation, algorithmic aesthetics, technological interventions in landscapes, and artificial intelligence as an ontological actor.
Project: Synthetic Landscapes
The Zone: Chimeras in Superfundland (2025)
Capstone project for the Synthetic Landscapes Program at SCI-Arc
How do we face extreme toxicity?
How do we stir ecological emergence into exceedingly uninhabitable sites?
Using algorithmic frameworks and containment structures around a toxic chemical plant designated a "superfund" site.
An essay about this project was published in Ecological Design Collective's publication "Litter: Antidotes to Toxicity" in 2026. To read more, click the link below.

Using a "circle-packing" algorithm to decimate the superfund site: a meso-scale "field of toxic blooms", rendered into a series of structures, craters, debris fields, and remediation zones; categorized by scale. (This image was created using ArcGIS, python in Claude Code, and Rhino)
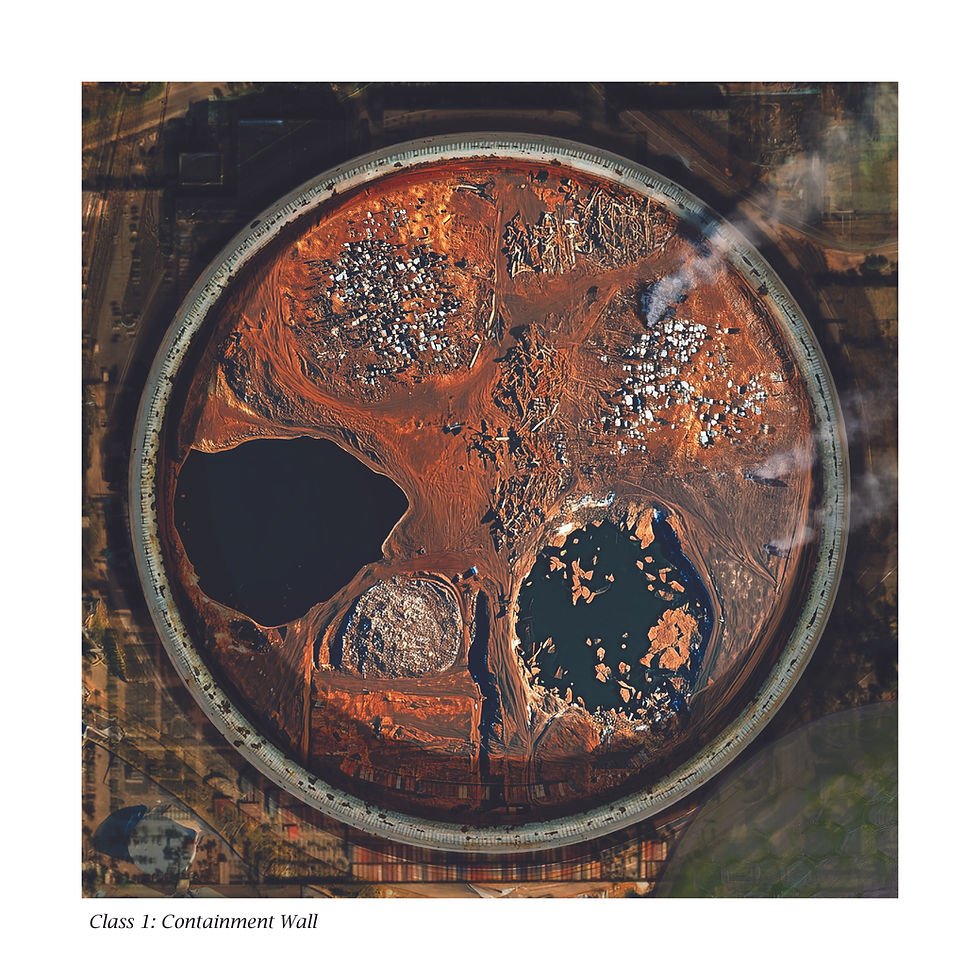


Aerial Imagery of The Zone
Imagining elements of "The Zone": Generated orthophotos (mimicking satellite or aerial photographs) of each Class of structure within the zone. These images were created using a recursive process, using Midjourney V7, Rhino, Midjourney Retexture, and Photoshop.

Base structure modelled using parametric tools on Rhino

Midjourney V7 used to retexture the model

Photoshop used to post-process the retextured model
An eerie lake forms with pooled rainwater and urban debris, with the massive structure creaking ominously as it tremors against the machinery.
Scenes from "The Zone", imagining the urban environment within the containment walls. (Created using Blender, Midjourney, and Unreal Engine with AI-generated audio)
Reality Capture
The Tidepools: Mumbai/Los Angeles (2026)
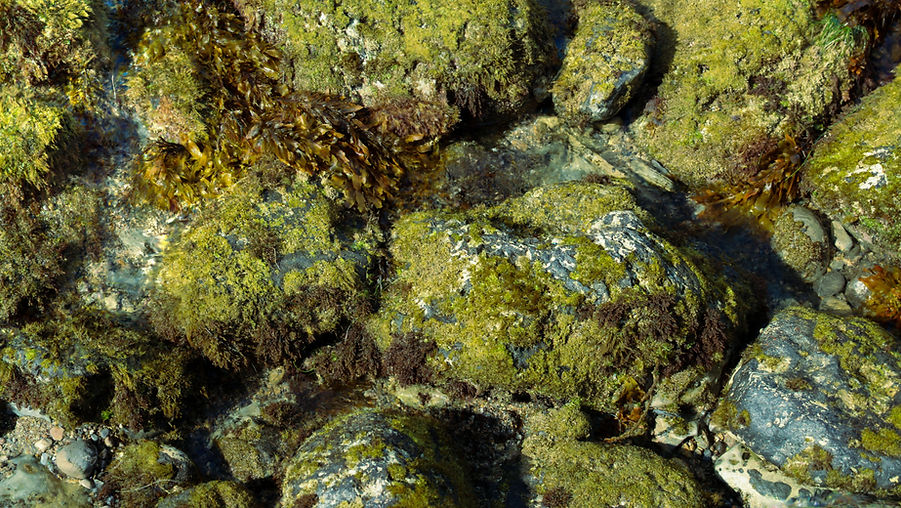
This is a 3D model.
This project is part of a collaborative proposal, with Gaurav Patil, a Marine Biologist and Photographer Based in Mumbai.
Tidepools are some of the most biodiverse, but overlooked ecosystems around the world.
Part of the reason for this is accessibility; tidepools are temporally fluid and usually available for pedestrian traffic through certain seasons. When the sea recedes, the rocky, often craggy landscape is dangerous for people with limited motor abilities. Few eyes are critically trained on these crucial ecosystems and their decline due to urbanization, invasive species and climate change.

I'm working with Gaurav, a marine biologist to create photorealistic virtual landscapes of intertidal zones in Maharashtra and Southern California, so that they can be studied and documented as 3D models.
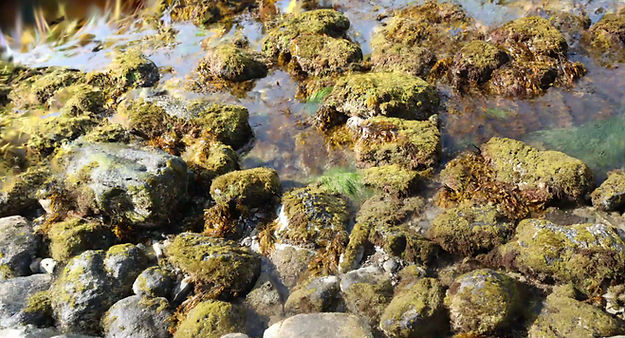
Panning around a test Gaussian Splat from an intertidal zone in Palos Verdes, California (Created using DSLR Photography and Postshot)
As a part of this process, we're exploring themes around virtualization as a visual or artistic endeavor, testing various technologies to "read" and represent tidepools, including multi-spectral imaging, infrared imaging, processing with Gaussian Splats and Photogrammetric models.

Multispectral imaging of the Palos Verdes intertidal zone, where algae and seaweed appear "purple".

Still from a 3D Gaussian Splat created using NDVI images. (Palos Verdes, California, capture by Kahin Vasi)
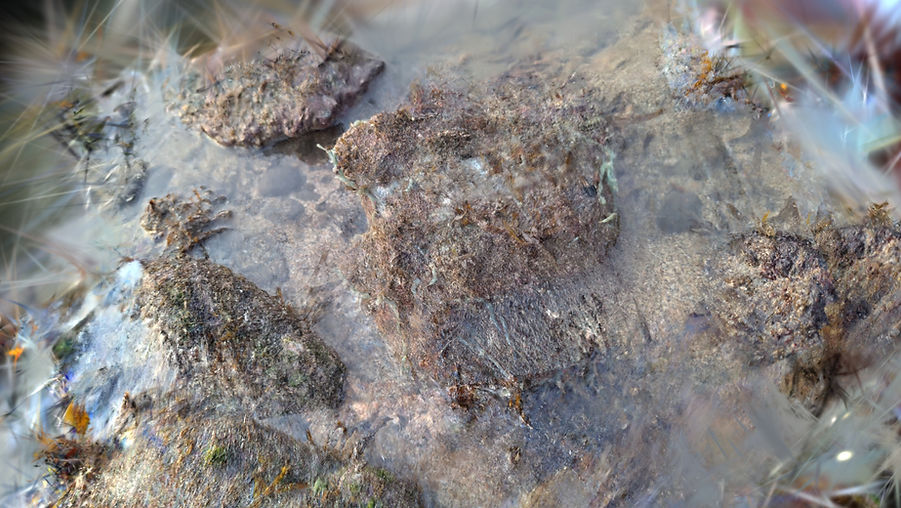
Still from a 3D Gaussian Splat created using smartphone video (Murud, Maharashtra, Captures by Gaurav Patil)

Photogrammetry Derived Pointcloud of intertidal rocks in Murud, Maharashtra. (Created using Metashape, Autodesk Recap, Photoshop. Video captures by Gaurav Patil)
What role does modern technology play in the way we interact with nature? Can virtual reality be more than pure reality? Can we layer spectrums, data, information and inferences onto a singular virtual landscape?

Python code built with Claude, allows Claude to analyse Gaussian splats and pointclouds and layer information from the internet onto the Gaussian splat, used as an education tool (Created using Claude Code and Python)
Project: Synthetic Landscapes
Disturbed (2025)
Disturb:
To agitate, to mix, to break up.
This project is based in Central Valley, CA.
How do you agitate farmland into a wetland ecosystem?
The speculative future of the farm; a bird's eye view.

Langer Farms, Central Valley, in 2025, satellite imagery


Future evolution of Langer Farms, from a dryland ecosystem to a water mixing facility. Created using QGIS, Midjourney v6, and Photoshop


Surfaces and Volumes
Bruno Latour's essay around the Actor Network Theory (ANT) talks about the "rhizome" as a replacement for a planar Cartesian surface, where, rather than subdividing land by area (a surface metric) we can study ecologies in terms of interaction networks (rhizome). To create these interactions between water and organisms, I render the farmland into a series of volumes within which these interactions take place.
The Cartesian grid is subdivided into units, each a power of -2 under the 1 mile Cartesian unit.
Cultures of bacteria, archaea, protozoans are "introduced" to the farm runoff, forming microbial trophic pyramids which "use up" the excess nutrients in the water. These trophic systems also bring in macro-faunal species such as migrating birds, mammals and amphibians to this pseudo-oasis within the Central Valley.


A longer evolution of Langer Farms, from a water mixing facility to a riparian ecosystem. Created using QGIS, Midjourney v6, and Photoshop

The process for creating these satellite images involves creating training data of various ecosystems through GIS images, combining and generating initial images, and collaging multiple images on the base image.
Scenes from the Biotic Water Treatment Facility in Central Valley, CA: The thrumming pumps moving water and microbial cultures through a network of pipes, creating lurid hues of water with various bacterial and algal blooms (created using Rhino, Houdini, Unreal Engine, and audio effects from Eleven Labs)
Built: Architecture
Karjat Home (2020-2024, execution phase)
In collaboration with Sayalee Golatkar, and aDRG: Architecture Design Research Guild (Mumbai)
Role: Designer, Sustainability Specialist (GRIHA metric)
Raighad, Rural Maharashtra, India
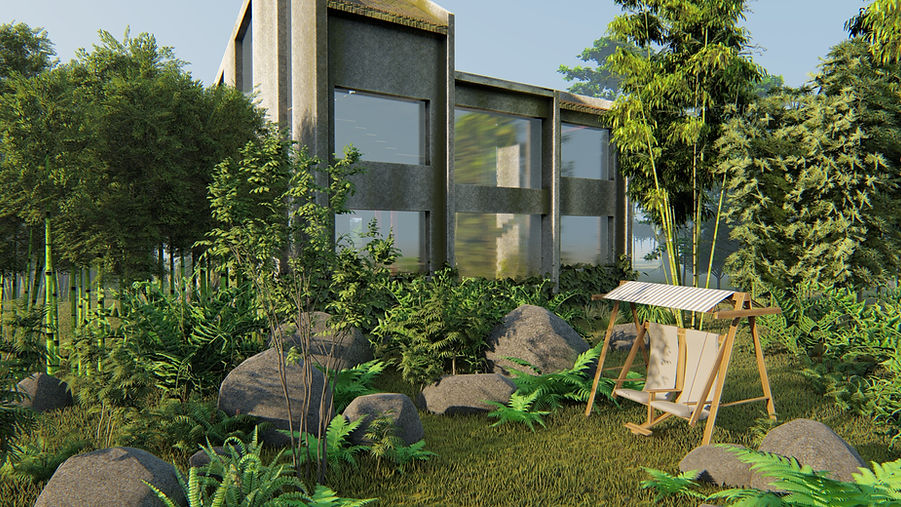
Early conceptual renders (2021) showing the landscape with local basalt rocks on site. (Created using Sketchup and Lumion)
Sustainability and Circularity
This project allowed me to experiment with various forms of material circularity across the built structure and landscape.
We have a tendency to create hard lines between anthropogenic and natural landscapes; this project was an exploration of how the building surfaces and volumes could be designed to maximize the formation of a natural patina, and a layer of moss on the walls of this building.
Each material was chosen as per sustainability standards according to GRIHA thresholds (GRIHA is an India-centric sustainability metric, a parallel to LEED). Furthermore, an effort was made to reduce the use of virgin materials in novel ways, including using urban demolition debris, upcycled timber, and products made with industrial soot and other carbon-based by-products.


I scouted out various sources for C&D waste, and with aDRG, implemented the use of processed debris in concrete mixes, and as an external "grit plaster" finish. These supply chains did not exist prior to our usage, so we worked directly with the processing facility to procure the materials we needed.

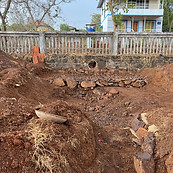
Circularity extends to the landscape structures as well; bioswales dug into the landscape were retained using jute sacks procured from local grain surplus stores (these sacks, when torn, are often burned or trashed). Rocks dug up during excavations were used to build water retention-infiltration tanks.
Sustainability Index
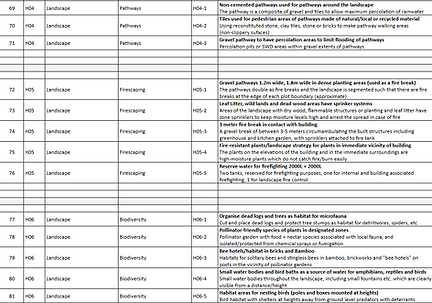
During the design development phase, I highlighted several interventions which would be part of the build, including but not limited to rainwater collection and usage, energy efficiency, reduction of high-carbon materials in the structure and finishes, fire safety, fenestration design, biodiversity and renewable energy on site. Some of these metrics are based on the GRIHA checklist for small structures, but the majority + possible interventions were delineated as part of an extended sustainability index which drove the tendering, material selection, and contracting process.
Click on the tables below to enlarge.


Climate-intelligent design
Formally, the structure of the home draws inspiration from the "overlapping slopes" of the Western Ghats, a low mountain range in the region.
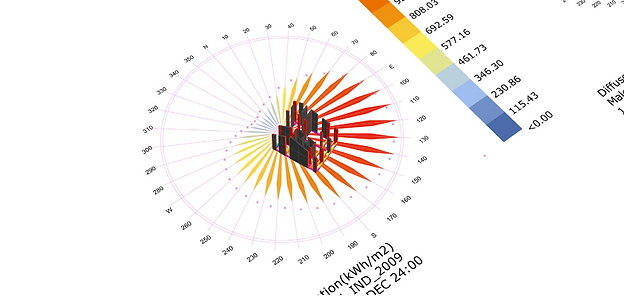
Analyzing the initial structure using EPW data with Grasshopper, we determined areas where we could tweak and move the structure, along with the orientation, to maximize daylighting while minimizing solar insolation and external thermal gain. The western wall, for example, is almost entirely closed off with a few small windows; diffused light makes it into the house through the north and south. Structural fins extend out from the core structure along the north and south to shade the verandah and porch.
With aDRG, we developed a specialized cavity wall structure which uses slender concrete columns with cement blocks wrapped around them to create a buffer against thermal gain. All external surfaces were painted with low-albedo heat-reflective paints.
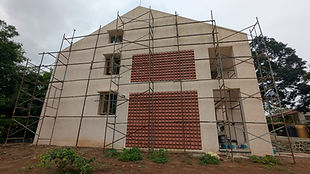
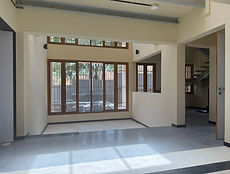
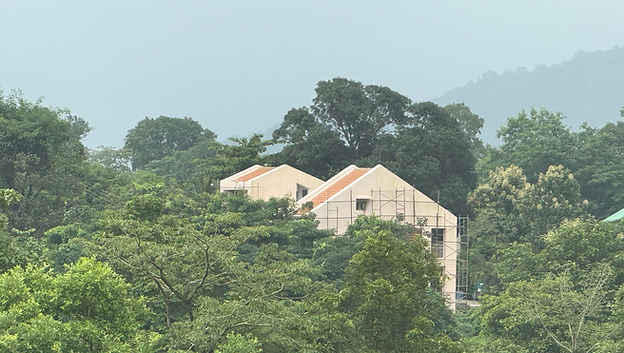
This project is currently in the furniture design stage, where we are using upcycled, reused and retrofitted antique furniture as low-carbon alternatives to bespoke furniture.
Project: Synthetic Landscapes
Noise Geographies (2024)

Everything is noise.
This project developed an ecological aesthetic around generated noise.
Acknowledging that most geological processes begin as chaotic changes at a planetary scale, gradually weathered into recognizable landscapes, I used procedural terrain tools to create aesthetics for primordial geographies.
I generated three distinct "worlds" with barren rock-based geographies, mirroring rock formations we might have encountered on early Earth.

[Audio + Video] Scenes from Noise Geographies: "Coastlines" and Rock Formations. Created using Procedural Worlds Gaia, Unity, Premiere Pro with audio synthesized on Garageband

Using a GIS, Image Generation, and Modeling workflow to create novel terrain maps (QGIS, Midjourney, and Photoshop)
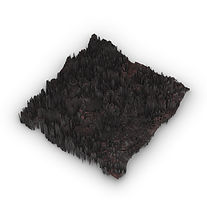
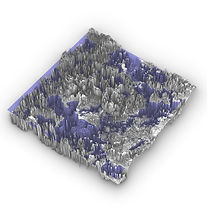
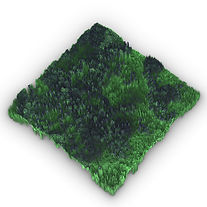
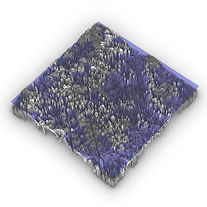

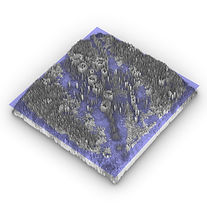
Models delineating the various geographies as rendered (top) and with a "sea level" indicator (bottom). Created using Unity, Rhino and Photoshop)

Cartography
Cartographical Videos & Models
Using ArcGIS to create maps, models and visualizations.
I've been working with several forms of geospatial information on a variety of projects, including site biodiversity and connectivity studies, regional ecological research, and wayfinding.
More recently, I've started looking at climate and environmental or urban risk with open source or ArcGIS licensed datasets.
These are some examples of videos created over the course of the Synthetic Landscapes Program.
A video shows a timelapse of recorded cyclone tracks over India; this dataset is intersected with district boundaries to give me an inferential model of the districts affected most by cyclones and cyclonic storms. (Created using ArcGIS and Premiere Pro)
I use geospatial datasets to inform design and intervention by synthesizing datasets through linking and analyzing multiple site factors. The district map in the video above is a novel dataset made with administrative boundary data and climate data.
I expand this to new ways of modelling and visualizing environments, including 3D printing over climate data.
Seen below: A 3D printed model created using waypoints and spatial data overlaid on a printed map of urban heat data from LA.

Assessing Risk over Deep Time
Torrance, CA
Sites with toxic contamination may be sealed away from current hazard events such as fires and minor calamities.
However, over longer timescales, the risk of catastrophic flooding and high-magnitude earthquakes increases significantly.
To represent this, I worked to bring the ArcGIS "Earth" model into Unreal Engine via an SDK, and used it to export cinematic "maps".
The audio features an upbeat-though-campy influencer-esque voiceover, breaking down the toxic zones and the hazards associated with it (this was used to mimic the way social media "discovers" information)

Risk Over Deep Time (Created using ArcGIS, ArcGIS SDK for Unreal Engine, Rhino, Fuser AI for B roll, Premiere Pro, with audio generated by ElevenLabs)
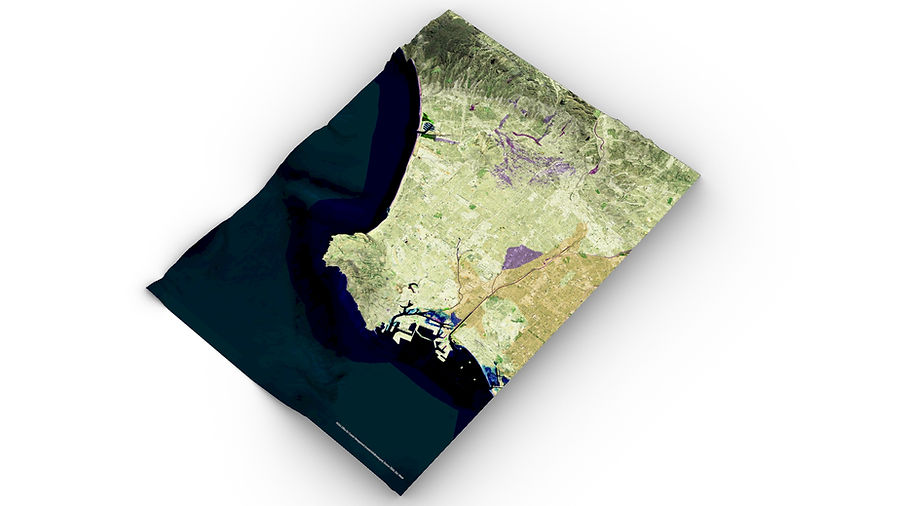
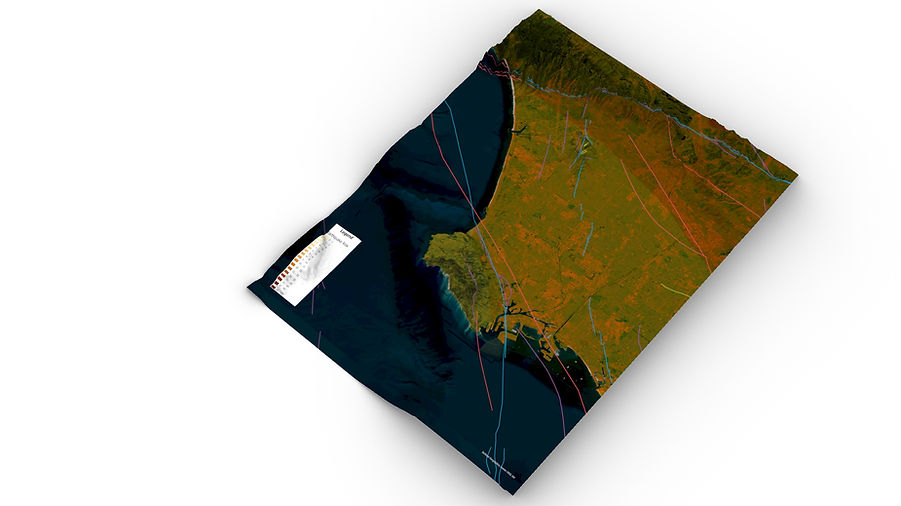
3D risk maps: Risk Maps overlaid on the terrain of Los Angeles (Created using ArcGIS, Grasshopper, Rhino)
Artificial Intelligence
Model Ecology
An AI-Enabled App to Simulate ecological succession in Landscapes
(In Beta Testing)
Tools can be built easily with generated code. While not particularly "Ship"-ready, these tools can be used for a series of inferential as practical tasks.
This tool started as an exploration of trophic systems in ecology, attempting to understand how a landscape may evolve over time given a certain set of starting species, terrain, and a specific ecological spread algorithm based on real-world simulation models.


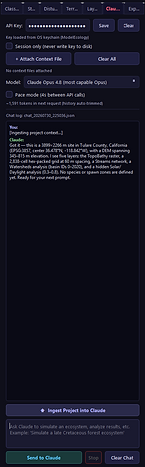


Click each panel to enlarge
A series of screenshots showing the various functionalities of the tool, from terrain analysis to species population, simulation algorithms, Claude API integration, and cellular metadata.

3D terrain corresponding to the placement of the cells exported out of the script. (Created using ModelEcology, ArcGIS, Rhino and Grasshopper)
Landscape
FBD Garden at SCI-Arc: SoCal Natives
created by students at SCI-Arc, with Salomon Cordova & I serving as landscape/horticulture advisers.
The FBD Garden was conceptualized as a green space to be used by the students as ancillary seating and as an ecological experiment which the students refer to for biodiversity or planting data.
My role, along with Salomon, was to ensure that the design created supports biodiversity and with a native plant palette.
Two garden beds were constructed, one with Chapparal Plants and another with Grassland/Meadow plants.

A multispectral image used to analyze "green" wavelengths as a check on the plant health (Taken with an NDVI camera)
Two planter beds were designed (primarily by the undergraduate students) with gabion walls as a slightly permeable enclosure for each of the gardens. We advised the use of gabion walls for the aesthetics, as well as potential habitat for small biodiversity (arthropods, birds, and small reptiles)
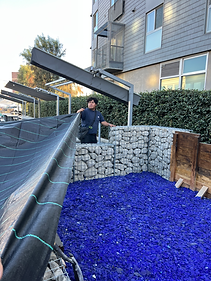
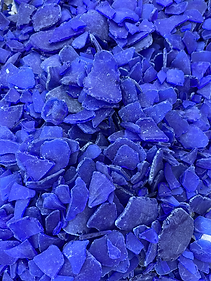
Besides the Gabions and sheets, the beds used upcycled timber for benches and recycled, crushed glass as a drainage layer under the soil.
We worked with the Theodore Payne Foundation, based in Los Angeles, to research and source Southern California Native plants, and, for about 8 months, grew "seed mixes" into saplings.
These were grown in a makeshift "greenhouse" set up by SCI-Arc Facilities in order for us to reduce costs by buying seed mixes rather than individual plants. Some larger, established shrub species were purchased weeks ahead of planting, allowing them to acclimatize to the environment.
Plants were selected around a single keystone species, one that fixes nitrogen into the soil, and symbiotic or partner species that work together with it to benefit the soil microbiome, micronutrients, and biodiversity.
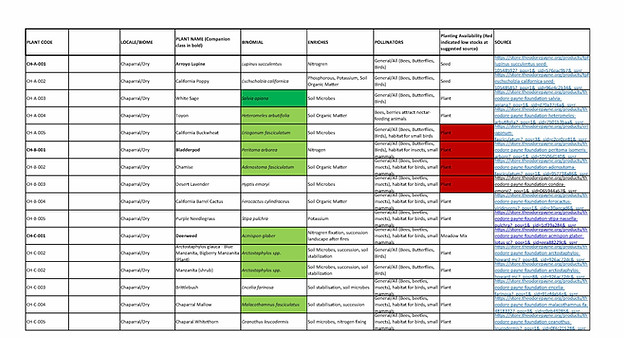
Click to enlarge.
A screenshot of the plantlist created to break down the ecological value including relationships, soil health, and biodiversity contributions of each plant


Click to enlarge.
Top to bottom: saplings grown from seed at SCI-Arc, larger, established plants procured from The Theodore Payne Foundation, planting set-up.


Click to enlarge.
3D scans of the two garden beds after initial planting, August 2025 (Created using RealityScan, Autodesk Recap, Photoshop)
Project: National University of Singapore, Integrated Sustainable Design
Carbon Masterplan (2024)
Capstone project at the Integrated Sustainable Design Studio
in collaboration with Sok Phaly Kok and Zan Chenyu
In the "Carbon Studio" during the Integrated Sustainable Design program, I explored strategies towards creating a Net Zero masterplan in Singapore.
This was a part of a larger, city-wide masterplan.
We considered factors including retrofitting older structures, local food production, energy economics, transportation and walkability, green spaces, and biodiversity.

Rendered view of the agroforestry and secondary forest area on site, enclosed by the residential complex on the right and the marketplace on the left. Beyond the trees, you can see the multistorey fish farm and two mid-rise commercial structures. (Created using Sketchup, Lumion, and Photoshop)
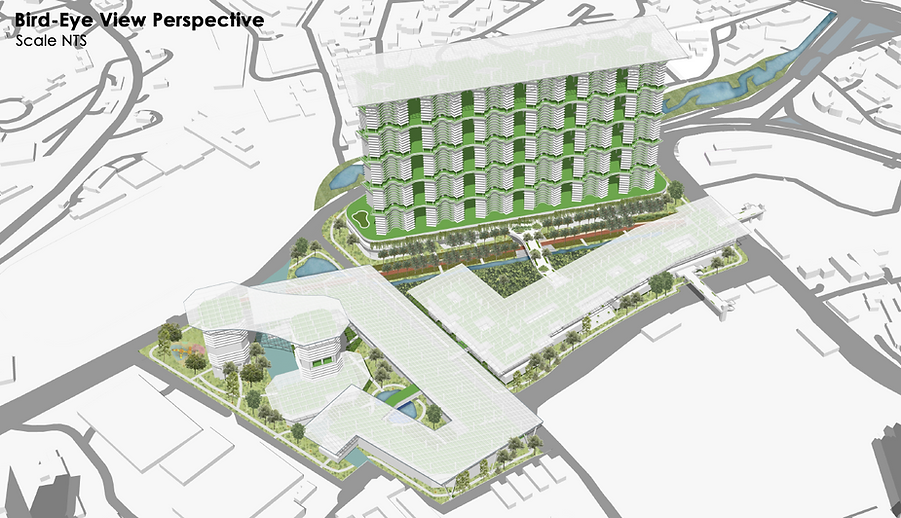

Click to enlarge.
Bird's Eye View of the Toa Payoh Masterplan, with the various carbon and energy efficiency strategies highlighted in the diagrams below. (Created using Sketchup, Illustrator and Photoshop)
Strategizing to create a "Net Zero Precinct" by 2073 (50 Years from the set-out), we availed several methods to ensure operational carbon was brought down.
1. Maximizing solar surfaces for both vertical and horizontal PV
2. Using Solar Surfaces as a thermal buffer
3. Phasing the project so that early developments use GLULAM and timber in low-rise structures
4. Developing Mixed-Use precincts with fish farms to reduce external dependence on imports
5. Doubling the "green cover" by implementing wetlands, vertical gardens and agroforestry
6. Reducing Operational Carbon of built structures with high-efficiency facades and materials
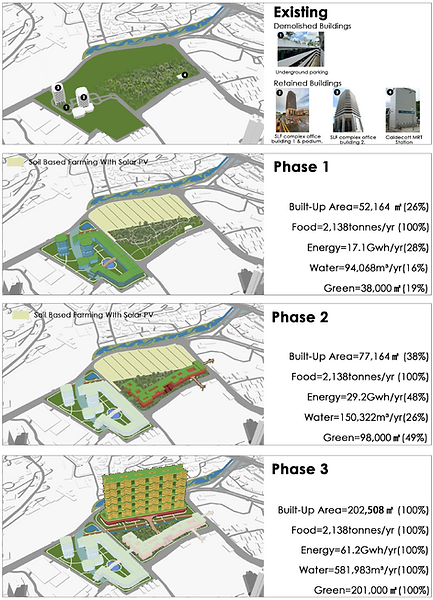
By phasing the project appropriately, we are able to set-aside future built-up area as agri-solar plots, allowing the production of food and energy on site which is fed back into the grid. Initial buildings are entirely low-rise structures built using timber and carbon-negative materials, so that there is a minimal uptick in the carbon footprint during the design phase. Later structures use RCC or a combination of RCC and mass timber structures, assuming there will be a significant development in low-carbon concrete.
Incidentally, the largest contributor to reducing the precinct's carbon footprint is the multi-storey fish farm, which offsets massive transportation and refrigeration costs from import of seafood.

Click to enlarge.
Calculating the carbon budget of the master plan; each phase assumes an additional carbon footprint for building, renovations and maintenance. Calculated with proprietary formulae as a part of the Carbon Studio, NUS ISD.

Rendered view of a wetland park and pedestrian bridge linking the commercial spaces with recreation areas. This masterplan strategizes to make the entire region a "walkable" district. (Created using Sketchup, Lumion, and Photoshop)
Research: National University of Singapore, Integrated Sustainable Design
City Livability Index (2023)
with Jerry Zhang, under Prof. Swinal Samanth
Part of the Integrated Sustainable Design Planning Studio included a research segment; we worked on "Livable Cities, Working to Create a novel Livability index which took into consideration design, climate resilience, and circular economics.

A Slide from the final presentation to Singapore's Urban Redevelopment Authority, URA, as a part of the ISD studio.
Noting that major Liveability Indices skew towards European cities based on economic, social and cultural factors, we created additional "pillars" to bring in population density, civic mobilization potential, and climatological resilience to consider cities where bottom-up infrastructural or institutional changes are prioritized.


Additional Slides showing how we assessed the "indicators" or urban liveability and proposed additional or different indicators to the systems, as well as the larger "Pillars & Indicators" schemes we proposed.
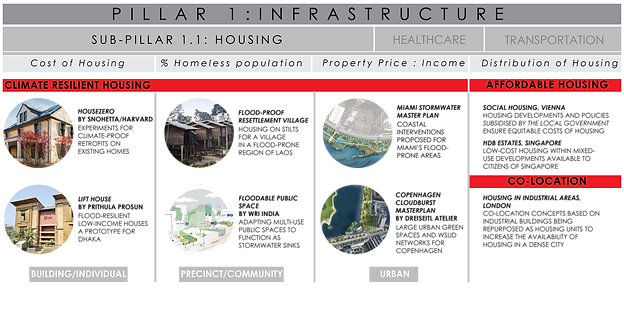

A survey of globally relevant models or initiatives to back up the indicators

Click to enlarge
Agency vs. objectivity in liveability: personal and private notions of what makes a city Liveable vs. Liveability at larger urban or regional scales
Fellowship
Urban Water Resilience in Mumbai (2021-2022)
part of the Kamla Raheja Vidyanidhi Research Fellowship, with Prof. Jamshed Bhiwandiwalla
In 2021, I was selected as a research fellow at my alma mater.
I produced a 20,000 word report on Urban Water Resilience in Mumbai, which included remote sensing, mapping, and a proposal for using abandoned industrial spaces in Mumbai to control urban flooding and make up the water deficit run by the city each summer by adding recycled greywater into the supply networks.
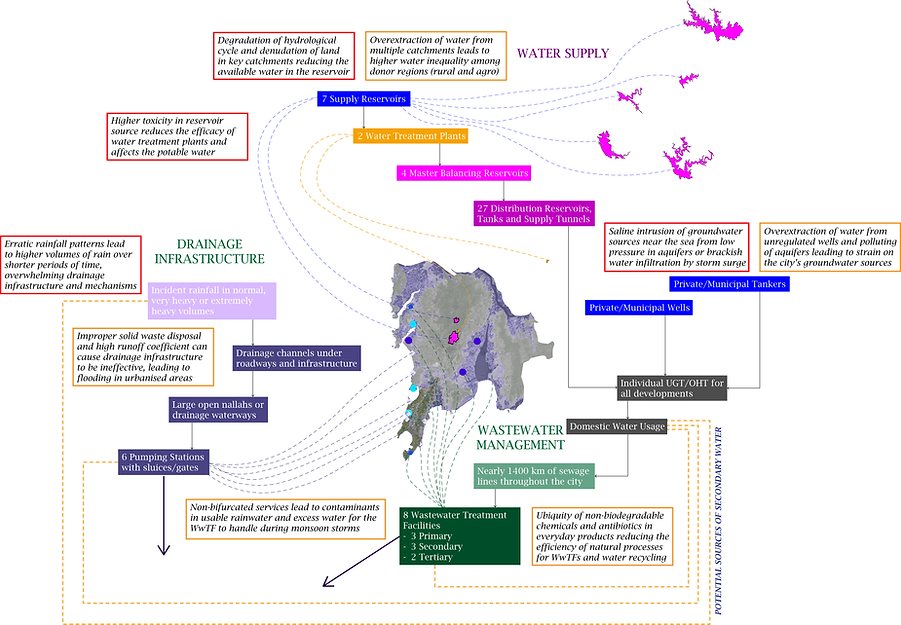
Click to enlarge.
Diagram showing water supply and drainage infrastructure in flows around the city of Mumbai.
Our research showed that while there is an almost annual water deficit in the city over the summer, future water demand can be met by augmenting the existing water supply with greywater, and collected rainwater, which offsets the early winter and late monsoon water usage significantly.

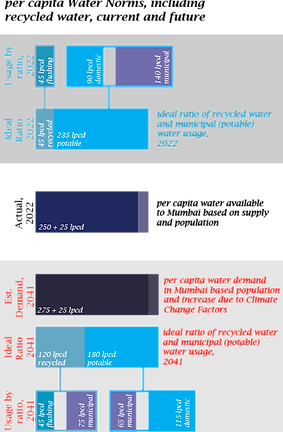
Click to enlarge.
Data analysis of the water which could potentially be recovered by using greywater for non-domestic functions. Water norms were recalculated factoring in Municipal water usage including landscaping, road washing, etc. (LPCD = litres per capita per day)
We studied the Mumbai Hydrometric Area (the extended area of municipal control where Mumbai receives its water from) in terms of vegetation, soil moisture, and "Ground Wetness", to ascertain seasonal periods where there is excess moisture and low moisture, dry vegetation or healthy vegetation. This went alongside a climatological study of the rainfall received and the potential hazards to the watershed ecosystems due to climate change.
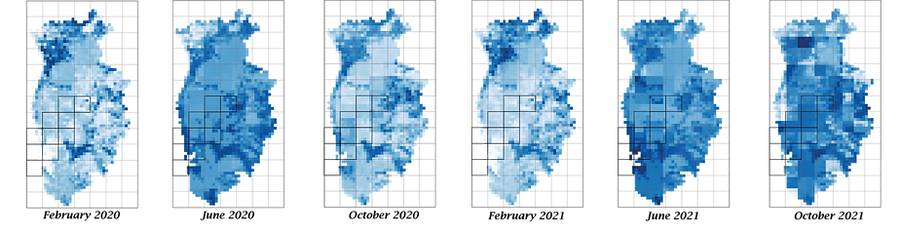


Click to enlarge.
Soil Moisture Content Mapped for the Mumbai Hydrometric Area, used to infer the reservoir refill/ecological moisture content of the contributing watersheds, ecosystems where Mumbai gets its water from.

Risks to the contributing watershed ecosystems of Mumbai's Water, assessed as a feedback loop
The extended report proposed "water reclamation precincts" within the city, where floodwater and greywater could be collected prior to outfalls and could be stored in or infiltrated into the earth for future usage.

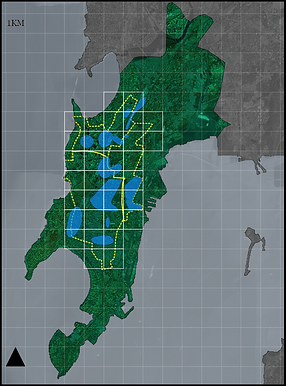
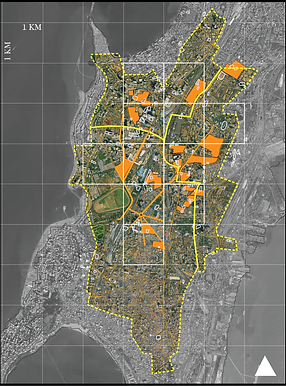
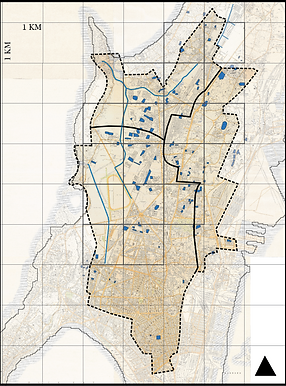
Mapping infrastructure, flooding, drainage networks and historical water supply systems in the same area in Mumbai
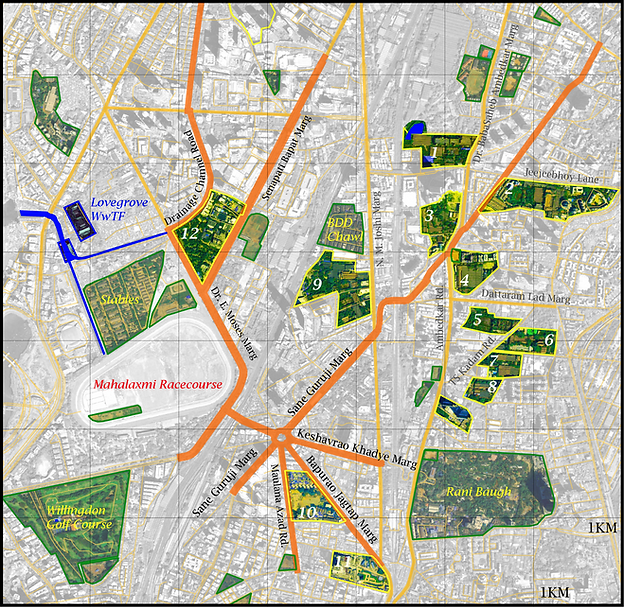
Proposed precinct interventions along legacy drainage networks in Mumbai.
Project
B.Arch Thesis: A Nanotechnology Centre
Capstone Project from my B.Arch
For my B.Arch thesis, I explored the potential of sustainable design for highly unsustainable programs. Nanotechnology facility based in the Indian Institute of Technology, Bombay
Nanotechnology Centres are a series of labs which, by definition, need 24x7 air conditioning, controlled lighting, hermetically sealed environments and a constant supply of power.
I designed these labs to specification as functional laboratories, creating spatial models of the equipment and lab design required for different kinds of labs.

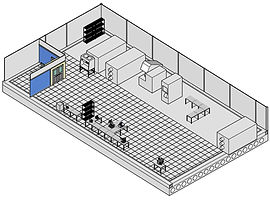
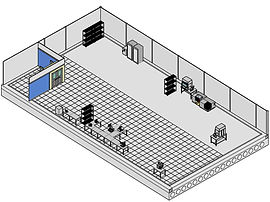
Lab Layouts as per laboratory specification and equipment set-ups for various functions
Beyond the core lab design, I worked to create "enclosures" around each lab with high thermal efficiency to reduce the temperature differential between the labs and the hot environment of Mumbai.

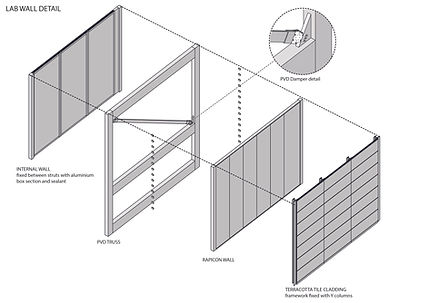
Exploded Axonometrics showing ballast slabs, vibrational dampers, various layers for lab walls to reduce the energy needed for cooling.
The site I selected was a secondary forest abutting two man-made reservoirs. My design intent included minimal ground disturbance and the possibility for successional landscapes after the 50-year operational time of the facility.
Labs were suspended above the ground with portals and trusses, while the ground was largely open for softscaping and native plant gardens.
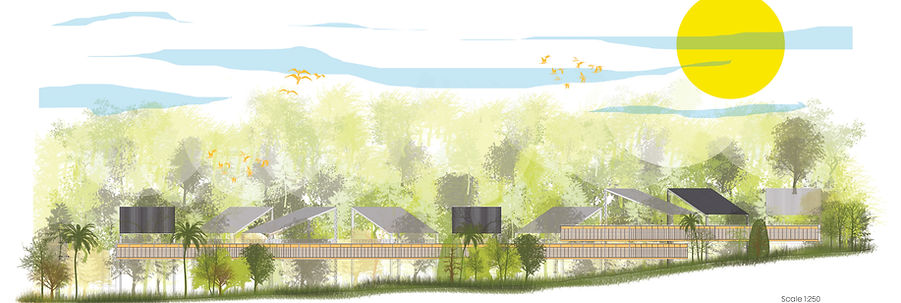

Project: Synthetic Landscapes
The Microcosm
Created in collaboration with Marti Vera Marsal, Ahmed Yakout, and Rudy Argote.
Part of the Synthetic Ecologies Seminar, Synthetic Landscapes.
The creation of a microcosm to study new ecological concepts.
This "terrarium" is a synthetic water body. The intent is to introduce microbes and algal cultures, documenting how the water changes through a timelapse recording of the terrarium over various stages of introductions, disturbances, and simulated ecological shocks.


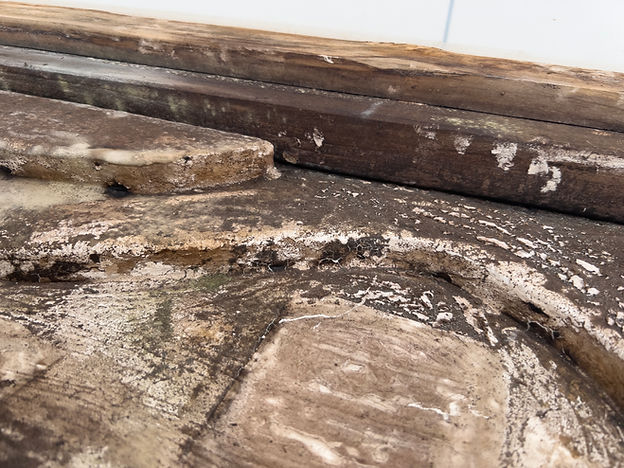
Organic deposits line the 3D-printed "introduction" apparatus, a truncated pyramid. Zoom in to see the details.
Between February and September 2025, this experiment ran (chaotically) with various "introductions" - each introduction leaving a trail or depositional layer of organic detritus in it's wake.

Representation of the microcosm: I used a "systems diagram" over time to map the various inputs, outputs, and conditions of the microcosm. This accounts for all the mechanical, static, environmental, and biotic components of the microcosm. (Authored by Kahin Vasi)


Samples of the detritus deposits in the microcosm show the presence of nematodes, various species of cyanobacteria and filamentous algae, fungal hyphae, paramecium and other zootrophic multicellular organisms. The cyanobacteria culture (pictured top centre) was developed from a water filter sample.
Our "aesthetic" sensibilities towards nature come from a notion of control; using chemical baths and additives to stem the growth of algae and fungi.
This experiment embraces the descent into ecological entropy as every element of the base breaks down and is layered with a crust of detritus.

When the terrarium dried out completely (this process can be seen towards the end of the timelapse), it left behind a crust of organic matter of the surface of the base, which - although coated with a white waterproof epoxy - soon became the substrate for fungal growth.
Experiments
Microhabitats
I created terrariums, aquariums, and microhabitats professionally for five years, something I still practice as a hobby today.
Gradually, my work on creating biotically sound enclosures (replete with flora and microfauna) slowly turned into a series of long-term experiments, studying the decay of organic matter over long time periods. This expanded to fungi and algae habitats, as well as a habitat dedicated to observing slime molds.
The Slime Mold Microhabitat (2024)

The slime mold habitat: slime mold was found on a branch from a site visit in 2024; this is the central branch (with visible mushrooms). The culture spread onto a wet paper towel which was used to transfer the slime mold to it's habitat.


The slime mold can be seen growing across various surfaces; all surfaces were sprayed with a bacteria-rich biofilm from aquariums, making it easier for the physarum to colonize the surfaces. The structure of the slime mold growth is visible clearly as it extends up the surface of the habitat.
Detritivore Microhabitats (2019 - 2025, ongoing)


Documenting cycles of decay in a detritivore microhabitat with wild isopods (species from India), recording the daily progression of the decomposition of shredded carrots as feed stock. These cycles were recorded near continuously for over a year.


Isopods in carious colonies, with a variety of climate conditions. (note: all isopods are stored in specially modified containers to ensure proper air flow, moisture, and colonies are split or released if the population within a colony gets too large)
These experiments often form the basis of several prompts or image generations, including as parts of training data where I create want to explore the aesthetic of rot, decay, and subterranean networks.

Experiments
Pixels, Points, and Splats
Working with digital tools in two- and three-dimensional spaces has lead me to develop novel ways of interacting with these media.
I've used AI to develop code which can manipulate images and 3D models by indexing and recognizing values of each unit - a pixel, point, or splat, allowing me to recompose each set as a generated or transformed collage, or simply to manipulate the location of the individual units.
Pixel Manipulations


Examples of images created using base data sets of satellite images, IR photography, Multispectral Photography, and photographs. Pixels are manipulated using Python scripts created iteratively using AI.


Using python code with built-in edge-detection algorithms, I can manipulate base images of Bayan Obo Mine (lower left) and Deonar Dumping Grounds (lower right).


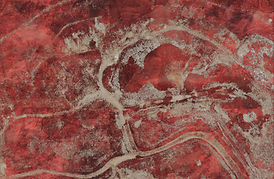


The script automatically creates a series of images using pixels which have been manipulated through various spatial mathematical algrorithms

Another python code created with AI indexes "strips" of pixels within photographs, and stitches them in sequences defined by similar mathematical, spatial algorithms


The generated images are then used in a further generative process by training styles or models in Fuser, ComfyUI, or Midjourney to create pseudo-real images.
Point Manipulations
Through LiDAR, Photogrammetry and 3D scanning, we're able to create dense pointclouds which capture three-dimensional space.
I used AI-generated scripts to manipulate and distort these 3D-pointclouds allowing me to create projections and flat "flattened" point cloud images, used largely in the Altadena Fire Scans Project as a part of SCI-Arc.
The Altadena Scans Project is a collaborative effort between the residents of Altadena, LACMA, Students and Faculty at SCI-Arc, with support from Scanlab Projects (UK) and a team of producers - Joel Feree, Sara Simon, Ade Ayoade, Natalie Rubio, Kahin Vasi, Marti Vera, Carlos Bonachea, Kai Johnson, Jillian Leedy, Sophie Pennetier, Pierce Meyers, and Matt Shaw - with the support of the SCI-Arc Resilient Futures Task Force, LACMA Art & Technology Lab, ScanLAB Projects, PT Capture, and The Little Things AI.
To learn more about this project, you can reach out to me at the email address at the end of this page.

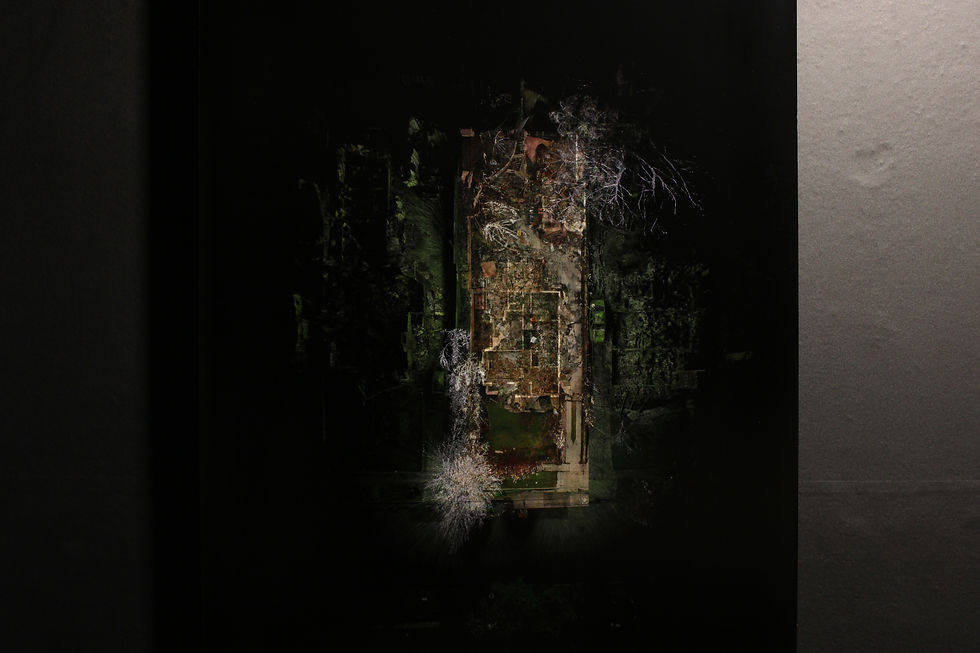

Photographs of the Altadena Scans exhibition at SCI-Arc in October 2025

An elevational profile of the six homes scanned after the Eaton Fire as part of the process of visualizing the effects of the fire. Created using python, AutoDesk ReCap, Photoshop, and Metashape
Splat Manipulations
New technology around 3D Gaussian Splatting (3DGS) has allowed more use cases of image-to-3D modelling to come up.
Similar to point clouds, each "splat" has a vector and a color/light value which can be manipulated. These can be done recursively with python scripts; however, we can also use ML-Run scripts to scatter or manipulate Gaussians. These models are far more lightweight than pointclouds are, making them easier to process computationally.

Custom python code created using Claude trained on the research/mathematics of Gaussian Splatting to create
a blended collage of splats.
